
TM 11-6625-2781-14&P-2
Section IV
control to place this marker exactly under the signal two
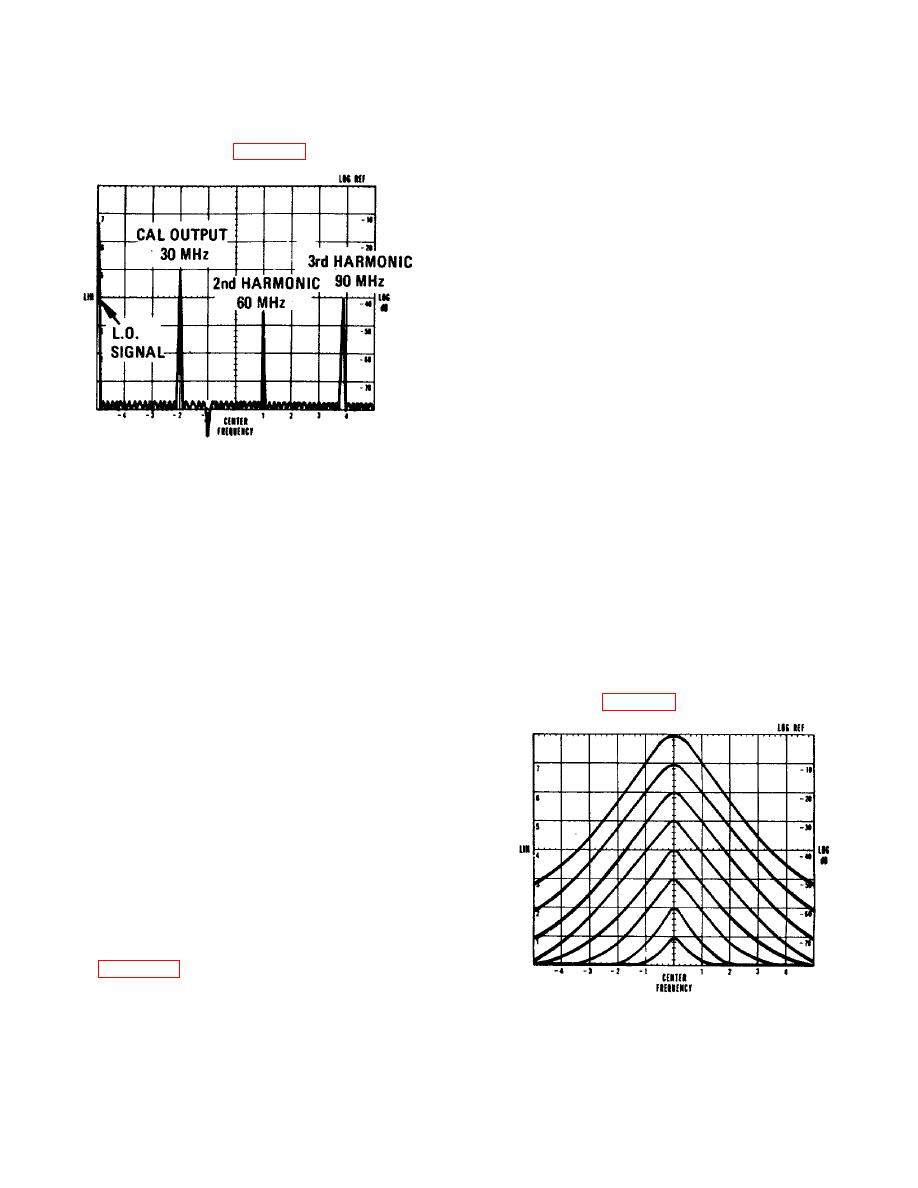
4-15. Connect CAL OUTPUT to RF INPUT using a
divisions from left of center. This signal is the 30 MHz
BNC-to-BNC cable. The analyzer CRT display should
calibrator signal. Tune the marker carefully to null the
be similar to that shown in Figure 4-1.
signal.
NOTE
The other signals on the display are
the "zero frequency" First LO
feedthrough and the 60 MHz and 90
MHz harmonics of the calibrator
signal.
d. Set the SCAN WIDTH PER DIVISION control to
.05 MHz and the BANDWIDTH to 10 kHz.
e. Switch the red SCAN WIDTH control to the PER
DIVISION position. The BANDWIDTH, SCAN WIDTH
PER DIVISION, and Center Frequency are now those
selected in steps c and d. (The marker makes it easy to
select any signal in 0-100 MHz scan and expand the
display about that signal.)
f. Adjust FREQUENCY tuning to center 30 MHz
calibrator signal, if necessary. Then reduce SCAN
WIDTH PER DIVISION to 10 kHz. Use FINE TUNE to
Figure 4-1. 30 MHz Calibrator Signal and Harmonics
center the signal on the display The analyzer's First LO
is automatically phase locked to a crystal oscillator
4-16. Display Section Adjustments.
reference for the blue color-coded SCAN WIDTH
positions since the TUNING STABILIZER was set to
a. Set IF section LOG REF LEVEL control max
ON. Therefore, the FREQUENCY control which tunes
ccw and SCAN TIME PER DIVISION control to 10
the First LO should not be used to tune the analyzer;
SECONDS.
frequency would tune in 100 kHz steps.)
b. Adjust
display
section
FOCUS
and
g. Adjust the LOG REF LEVEL controls so the
ASTIGMATISM controls for the smallest round spot
maximum signal amplitude is exactly on -70 dB
possible.
graticule line. Rotate LOG REF LEVEL control seven
c. Reset SCAN TIME PER DIVISION control to 5
steps in the clockwise direction. The amplitude of the
MILLISECONDS and adjust TRACE ALIGN so that the
signal should increase in increments of one division per
horizontal base line of the CRT trace is exactly parallel
10-dB step. See Figure 4-2.
to the horizontal graticule lines.
4-17. IF Section Adjustments
a. Adjust VERTICAL POSITION so that the
horizontal base line of the CRT trace is exactly on the
bottom horizontal graticule line of the CRT. Set LOG
REF LEVEL to 0 dBm.
b. Adjust HORIZONTAL POSITION so display is
centered on CRT. Then adjust HORIZONTAL GAIN
until the displayed scan width is exactly 10 divisions.
Some interaction between HORIZONTAL POSITION
and GAIN may occur, requiring slight readjustment of
the controls. The display on your CRT should now
match Figure 4-1 almost exactly. (The amplitudes of
the individual signals may be slightly different.)
c. Note the inverted marker below the bottom
graticule line. This marker indicates the 4-2 display
Figure 4-2. Vertical Gain Adjustment
Center Frequency of the ZERO and SCAN WIDTH PER
DIVISION tuning modes. Adjust the FREQUENCY
4-2
