
TM 11-6625-2781-14&P-2
Section IV
PERFORMANCE TESTS (cont'd)
4-27. Average Noise Level (cont'd)
ANALYZER Control Settings (cont'd)
SCAN WIDTH ................................ ................................ ................................ ................................ ................. ZERO
INPUT ATTENUATION................................ ................................ ................................ ................................ ...... 0 dB
BASE LINE CLIPPER ................................ ................................ ................................ ................................ ......... ccw
SCAN TIME PER DIVISION ................................ ................................ ................................ ...... 50 MILLISECONDS
LOG REF LEVEL ................................ ................................ ................................ ................................ ............ 0 dBm
LOG REF LEVEL Vernier................................ ................................ ................................ ................................ ......O0
LOG-LINEAR ................................ ................................ ................................ ................................ ..................... LOG
VIDEO FILTER ................................ ................................ ................................ ................................ .............. 100 Hz
SCAN MODE ................................ ................................ ................................ ................................ ....................... INT
SCAN TRIGGER ................................ ................................ ................................ ................................ ............ AUTO
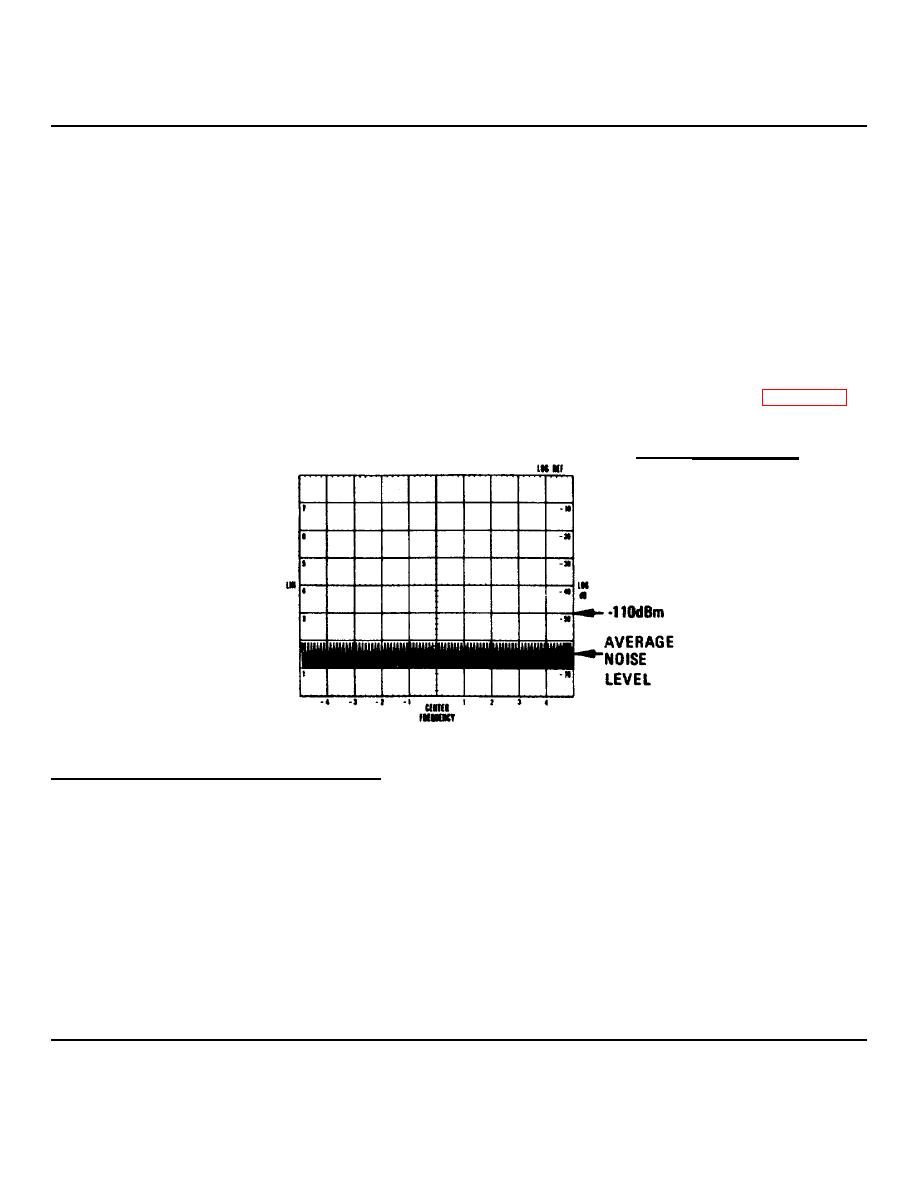
3. Observe the average noise power level on the CRT. It should be lower than -110 dBm as shown in Figure 4-11 as
frequency is tuned from 110 MHz to 1 MHz. Make sure the LOG REF LEVEL vernier is set at 0 during the
measurement.
-110 dBm
Figure 4-11. Sensitivity Measurement: CRT Display
4-28. Spurious Responses
SPECIFICATIONS:
For -40 dBm signal level at the input mixer*, image responses, out-of-band mixing responses, harmonic and
intermodulation distortion and IF feedthrough responses are all more than 70 dB below the signal level at input mixer: 2
MHz to 110 MHz, 60 dB: 1 kHz to 2 MHz.
Third Order Intermodulation Products: For -40 dBm signal level at input mixer* third order intermodulation products are
more than 70 dB down for input signals of 100 kHz to 110 MHz.
*Signal level at Input mixer - Signal level at RF INPUT - INPUT ATTENUATION.
4-16
